Compare Section

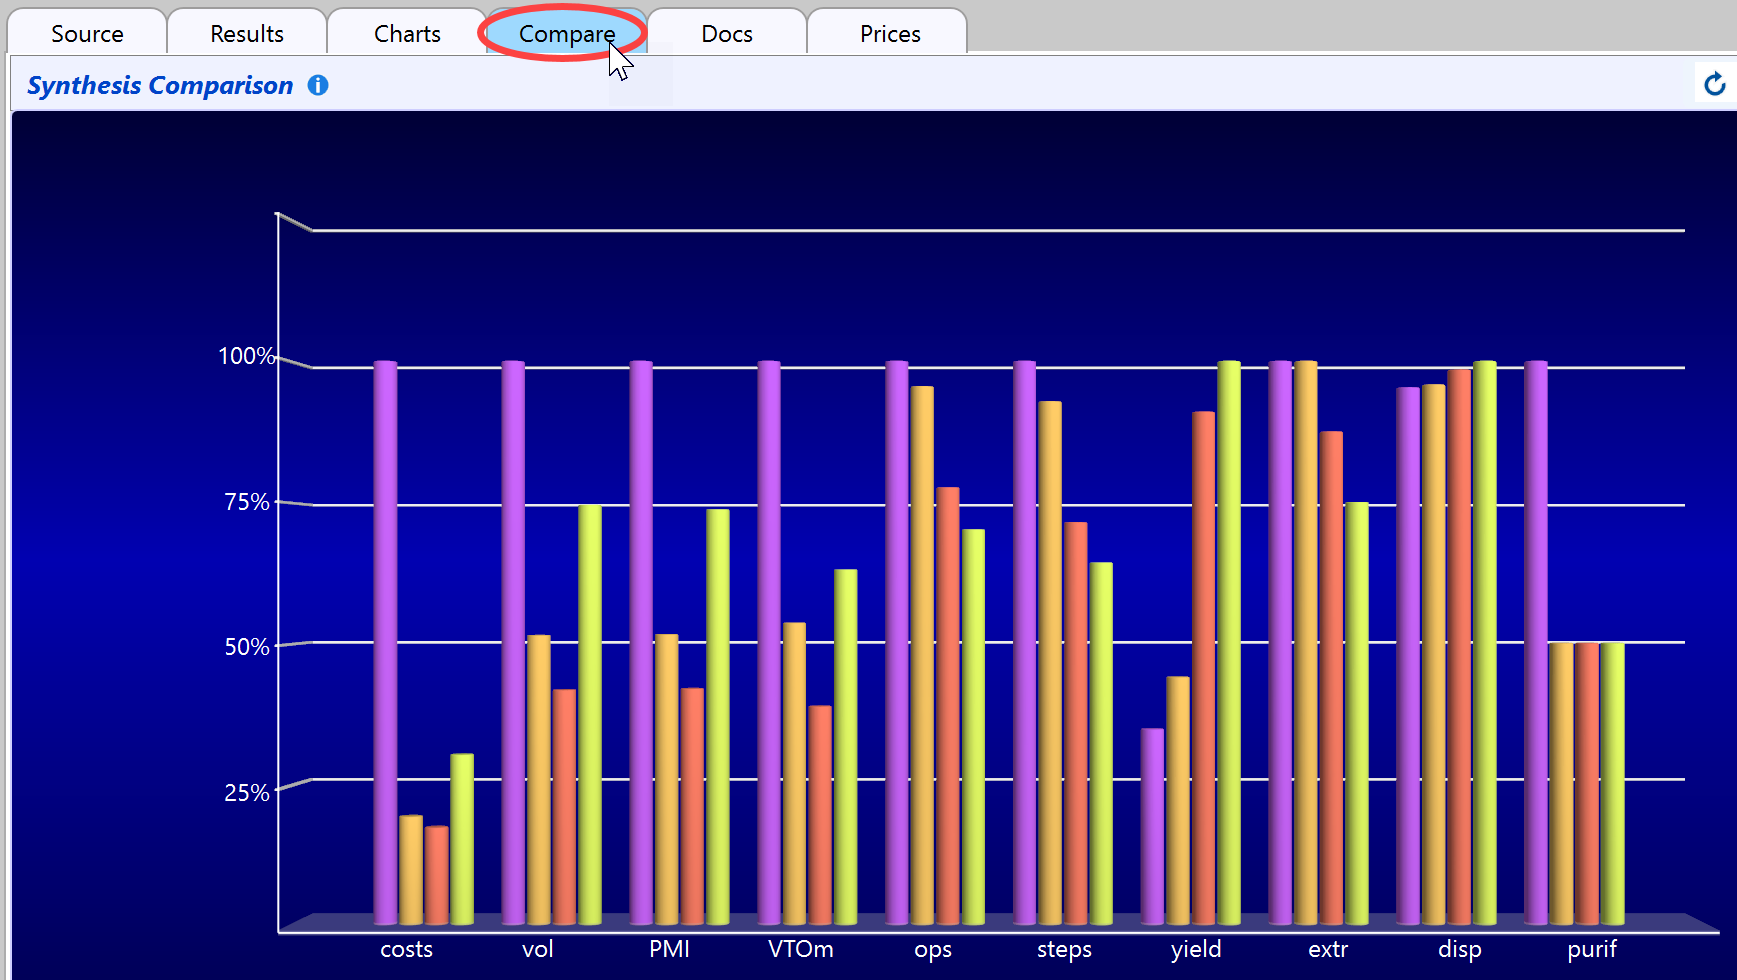
This section allows the direct comparison of syntheses, based on relevant key properties. This permits the assessment of different synthetic approaches towards a common target, as well as monitoring the optimization progress within the same approach over time (status snapshots), among other scenarios.
Compared syntheses and their individual parameters can interactively be hidden/shown in the comparison chart for focusing on specific points of interest, as well as being sorted in ascending and descending manner. This also makes this comparison functionality a well suited place for interactive and dynamic presentations.
Compared Syntheses

The table located below the comparison charts contains all synthesis properties in numeric form. Clicking one of the chart bars highlights the corresponding table value. Clicking the header of a table column sorts its values in ascending and descending order (after a second click).
Syntheses can be added to the comparison by clicking the "Add Synthesis" button, and be removed by clicking the "X" delete icon to their right. Their visibility in the comparison chart can be toggled by unchecking and checking the check boxes to their left.
The Copy button copies the contents of the table to the clipboard, the Export button allows to save the contents as CSV file, which can be opened e.g. by Excel.
Changes to the current synthesis are updated immediately in the comparisons. Changes to the other, referenced syntheses need to be updated manually by clicking the Refresh button in the toolbar:
![]()
Comparison Parameters
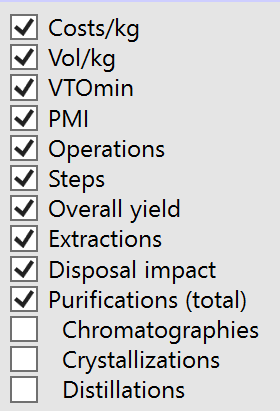
The visibility of the various synthesis comparison parameters within the comparison chart can be specified in the property selection area:

The individual parameters are defined as below:
- Costs/kg: Material and operating costs per kg final product.
- Vol/kg: Volume throughput, i.e. the sum of added and transferred materials. Material weights are approximated as volumes.
- VTOmin: The Minimum Volume-Time Output parameter reflects the minimal achievable impact of a process on the cost of occupancy of a production infrastructure. Lower values are better. The calculation of this parameter requires all unit operation times to be specified. If some are missing, an info icon appears instead of a value in the comparison table (see the 'Missing Data Info' section below).
- PMI: The Process Mass Intensity parameter reflects the material efficiency of a process. Lower values are better. If some volumes cannot be converted to weights, either an info icon with a help tooltip are displayed (external syntheses), or a missing density notification button appears in the chart area (current synthesis):
- Operations: The total number of unit operations present.
- Steps: The total number of steps. Please note that the number of unit operations and purifications is more indicative than the number of steps alone (a step can be very simply or highly complex to perform).
- Yield%: The overall yield of the synthesis, across all branches of the synthesis (not only the main branch, if convergent).
- Extractions: The number of extractions occurring the synthesis.
- Disposal Impact: The Disposal Impact parameter of a synthesis determines the influence of the utilized materials on the disposal and/or recycling costs. A value of 1 is best, 5 is worst.
- Purifications (total): The number of purifications occurring in the synthesis.
- Chromatographies: The number of chromatographies occurring in the synthesis.
- Crystallizations: The number of crystallizations occurring in the synthesis.
- Distillations: The number of distillations occurring in the synthesis.
Missing Data Info
The VTOmin and PMI parameters require an extended set of data for calculation. The icon below appears if some data in the current synthesis (the one marked by a light yellow background) are missing. Clicking the icon opens a dialog where the missing data conveniently can be completed.
 .
.
If the other external comparison projects are missing data, then the icon below appears, providing instructions on the required steps for data completion.
Save & Copy
The contents of this Comparison Section can copied to the clipboard or saved as high resolution jpg image, e.g. for inclusion into presentations or reports:
![]()