Charts Section

Chart analyses provide a visual comparison of various synthesis key values on the unit operation and step level. This allows the immediate identification of problematic areas and optimization hot spots.
Unit Operation Charts
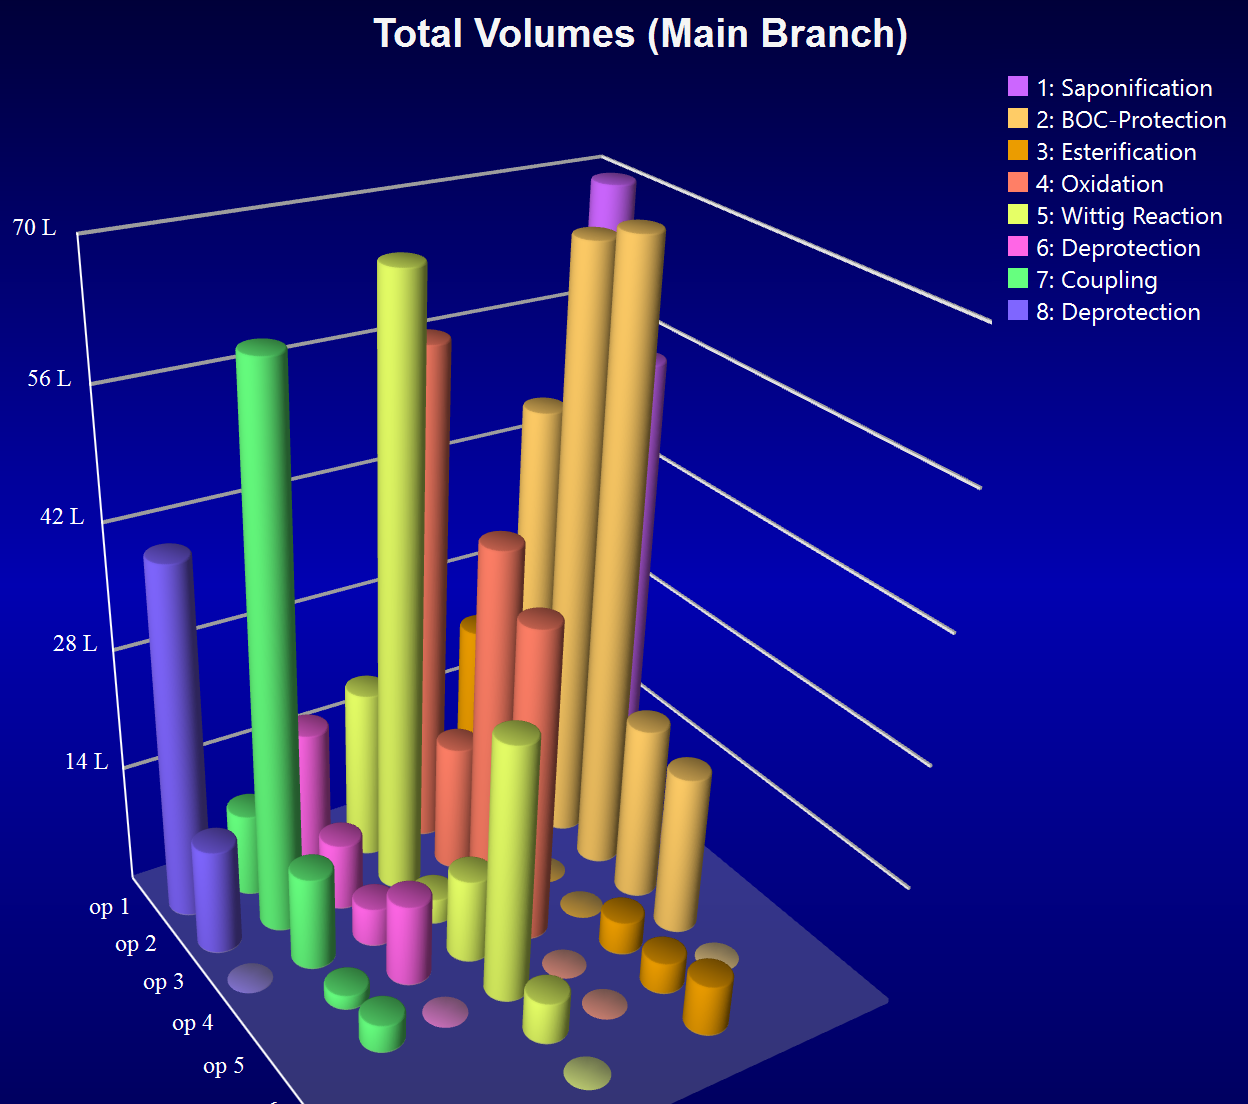
This chart type provides key values per unit operation in a step/operation/value space. Each step of a specific branch is represented as a series of distinct chart cylinders of the same color. Unusually high unit operation properties, e.g. an unusually high operation volume, can easily be spotted here. The additional branch(es) of convergent syntheses can be selected for display from the left side panel ("Select Branch" area).

The chart can be interactively rotated in 3D space per mouse-drag. Selecting a data bar displays the underlying unit operation data in a box to the right of the chart. Following analysis types are available for this 3D chart; please refer to volume handling for an explanation of the volume types mentioned below:
- Materials Cost: Costs of all materials added to a unit operation (but not imported from another branch) .
- Total Volumes: Sum of all materials actually added (but not transferred) to a unit operation.
- Max Volumes: Maximum expected unit operation volume as determined from all added materials, transfer volumes and exchange volumes.
- Observed Volumes: Observed volumes, as specified in the Source Data section, scaled to the current synthesis size.
- Volume Intensities: The maximum required unit operation volume in liters per kg step product.
- Locate Material: Maps all occurrences of a material within the synthesis, the size of the columns indicating its total volume per unit operation. Clicking the Locate Material selector opens a dropdown menu displaying all materials utilized in the synthesis, in alphabetical order. Once a material is selected, the dropdown menu can be re-opened for further selection. Double clicking a material bar in the chart drills down the view to the corresponding unit operation in the source view, highlighting the respective material occurrence(s). Only the branches in which the material actually occurs can be selected.
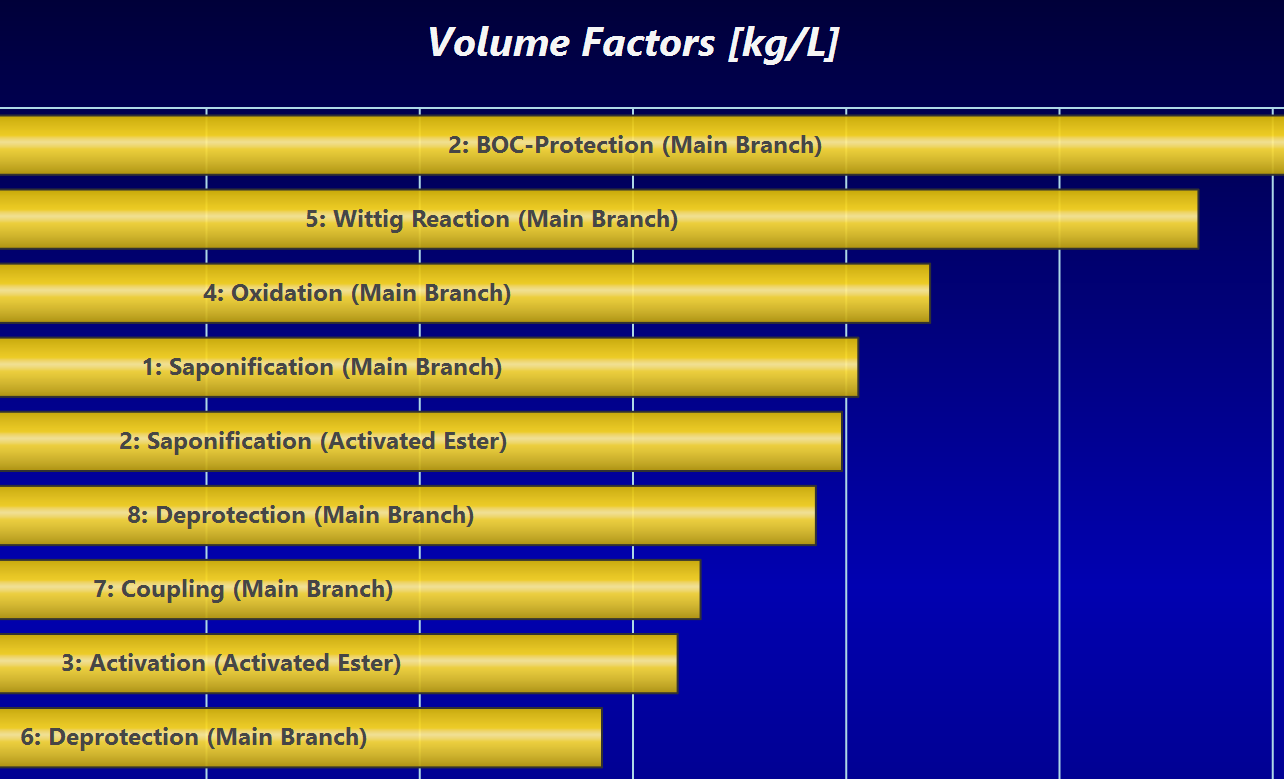
This chart type provides key values per step, across all branches present in the synthesis. Hovering the mouse over a chart bar displays a tool tip containing the underlying data.

Following analysis types are available:
- Max Step Volumes: Displays a summary of the maximum required step volumes, as calculated from the sum of added & transferred materials and corrected by exchange volumes.
- Disposal Volumes: This is a specialized variant of above analysis, displaying the step volume bars as stacked disposal category volumes (see Disposal Assessment). Clicking a colored bar segment displays a legend with detailed waste group information.
- Volume Factors: Displays a summary of the step volume in liters required for obtaining 1 kg of step product. See the Volume Factor analysis type for more information .
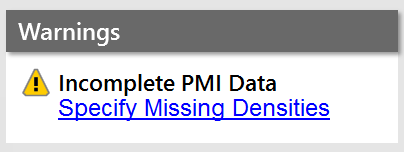
- Process Mass Intensities (PMI): The PMI is the total of the material weights required to obtain 1 kg of step product. Lower values are better. For more details see the PMI analysis type. If some material amounts can't be converted to volumes, a warning message appears:

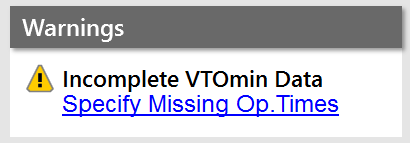
- Min. Volume-Time Output (VTOmin): Reflects the minimal achievable impact of a chemical process on the cost of occupancy of a production infrastructure. Lower values are better. For details see the VTOmin analysis type. If some required operating times are missing, a warning message appears:

- Intermed Values / Mol: Displays the material costs per Mol step product, grouped by branch.
- Top Cost Materials: Displays a summary of the materials causing the highest material costs within the synthesis.
- Yield Impact: The yield impact analysis facilitates the location of steps with the highest potential on overall cost reduction upon yield improvement. See the Yield Impact analysis type for more details
A high resolution screen shot of all analyses can be copied to the clipboard or saved to as file by utilizing the corresponding section toolbar buttons:
![]()